Why I Built a Guideline-Driven Blood Pressure Checker (And the Problem with “Normal”)
As the founder of BioSense Review, I developed the Blood Pressure Checker to solve a persistent clinical data problem. Standard online calculators consistently fail to reflect the current and often conflicting international cardiovascular guidelines. I needed a client-side architecture that evaluates systolic and diastolic inputs simultaneously against the 2025 AHA/ACC, 2024 ESC, and NICE NG136 frameworks.
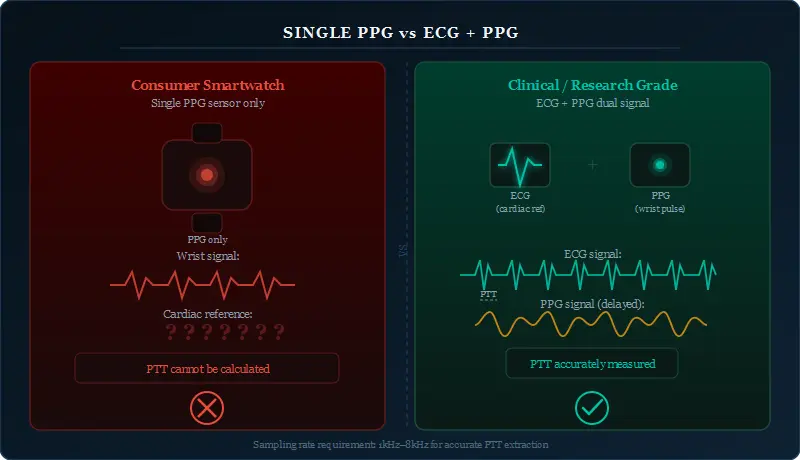
My work in cardiovascular sensor architecture involves engineering a wearable cuffless blood pressure device for the US and European markets, alongside designing a cuffless hemodynamic monitoring toilet seat system for a leading Japanese manufacturer. Building hardware to capture this data made it clear that getting the numbers is only half the challenge. Interpreting those numbers accurately, especially when American and European medical guidelines disagree, requires a highly precise software architecture.
The Divergence Starting at 120 mmHg
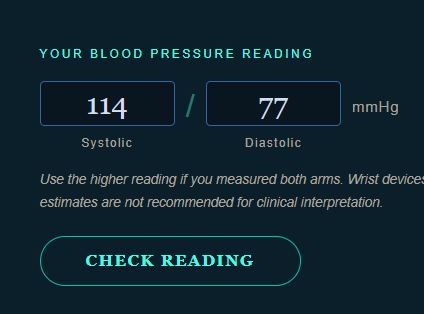
The core algorithm of the tool accounts for the fundamental disagreement between American and European diagnostic criteria. While all major guidelines agree that a reading strictly below 120/80 mmHg is optimal, the classification of the subsequent ranges diverges immediately.
- The 120-129 mmHg Range: Under the AHA 2025 guidelines, any systolic reading of 120 mmHg or higher is no longer fully normal; the algorithm flags it as “Elevated.” Conversely, the ESC 2024 guidelines still classify this exact range as “Normal.”
- The 130-139 mmHg Range: The divergence widens here. The AHA defines this as Stage 1 Hypertension, indicating clinical intervention. The ESC categorizes it only as Elevated Blood Pressure, not hypertension.
- The Clinical Output: The tool maps both interpretations simultaneously. When you input a systolic value of 120 or 132, the interface deliberately shows the disparity, empowering the user with guideline-specific context rather than a generic warning.
Neurovascular Dynamics and Mean Arterial Pressure
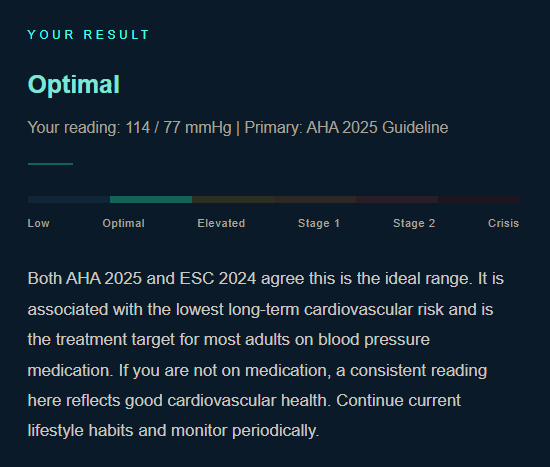
The tool takes your systolic and diastolic numbers and figures out which category you fall into. In cardiovascular physiology, these two numbers determine how well your vital organs are being perfused. That’s where Mean Arterial Pressure (MAP) comes in.
Here’s the basic formula: MAP ≈ DP + 1/3(SP – DP). Diastolic pressure (DP) gets more weight because your heart spends more time relaxing than pumping. The tool categorizes your raw inputs, but what actually matters physiologically is maintaining a MAP high enough to keep blood flowing to your brain and organs, without letting it get so high that it damages your artery walls.
Data Privacy and Measurement Integrity
I built this entirely on client-side JavaScript. When you enter your numbers, everything processes locally in your browser. No biometric data gets sent to any server. What you type stays on your machine.
That said, the output is only as good as what you put in. I’ve spent years working on cuffless estimation tech, but for home use, a validated upper-arm cuff is still the gold standard. Blood pressure follows your body’s natural daily rhythm. To get a usable reading, you need to sit still for five minutes beforehand. And those smartwatch estimates? They’re not there yet. Not for this level of categorization.
Frequently Asked Questions About Blood Pressure Dynamics
Why do American (AHA) and European (ESC) blood pressure guidelines differ?
Basically, Americans and Europeans read the same data and came to different conclusions. The AHA takes an earlier-intervention approach. They lowered the hypertension threshold to 130/80 mmHg to get people making lifestyle changes before potential issues develop. The ESC kept the threshold at 140/90 mmHg. Their thinking is that if your ten-year risk is low, you shouldn’t be automatically labeled as hypertensive or put on medication.
Can an optical smartwatch accurately measure blood pressure at home?
Not really, at least not yet. As of 2026, those watches use PPG sensors, which measure changes in blood volume, not actual pressure. They need regular calibration against a real cuff to function. The tech is getting better, but if you want a reliable number for tracking, stick with a validated upper-arm cuff for now.
What is Mean Arterial Pressure (MAP) and why does it matter?
MAP is the average pressure in your arteries during one complete heartbeat. It gives you a broader picture of what’s going on than just looking at the top number. A normal MAP usually falls somewhere between 70 and 100 mmHg. If it consistently drops below 60 mmHg, that’s worth mentioning to your doctor.
Test your metrics against the current guidelines using the local application here: Blood Pressure Checker.
Disclaimer: The information and tools provided on this platform are for educational purposes only and do not constitute professional medical advice, diagnosis, or treatment. Always consult a qualified healthcare provider with any questions you may have regarding a medical condition.