The First FDA Cleared Cuffless Blood Pressure Monitor: What Aktiia Hilo Actually Does
In July 2025, Aktiia Hilo became the first cuffless blood pressure monitor to receive FDA clearance. This article explains how it works, what its optical sensor measures, why calibration keeps it accurate, and what the FDA clearance means for users. If you want to understand the technology behind this new device, read on.
What 510(k) Clearance Actually Means
Continuous blood pressure monitoring is still an unsolved problem. But Aktiia Hilo represents a significant step toward a solution.
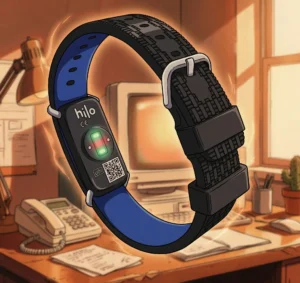
Aktiia Hilo uses a single optical sensor. It analyzes how the shape of the pulse signal changes over time. From that, it estimates systolic and diastolic blood pressure.
In July 2025, the Aktiia Hilo received FDA 510(k) clearance. The official number is K250415. This clearance means the FDA has reviewed the device and found it to be substantially equivalent to a predicate device already on the market. It is an important regulatory milestone that allows Aktiia to bring its technology to US consumers.
The 510(k) pathway requires the manufacturer to demonstrate that their device performs similarly to an existing device within certain error margins. The FDA does not independently test the device, but relies on the data provided by the manufacturer. This is the standard pathway for most medical devices that are not completely new to the market.
Where Aktiia Came From
Aktiia is a Swiss company based in Neuchâtel, founded in 2018. But the technology did not start with the company. It grew out of research at CSEM, the Swiss Center for Electronics and Microtechnology, one of Europe’s leading applied research institutions. The core algorithm was in development for nearly two decades before the product reached consumers. Josep Sola, a biomedical engineer and co-founder of Aktiia, was among the researchers who developed it.
Before the US launch, Aktiia Hilo was already on the market in Europe with a CE Class IIa certification. That is the European designation for medium-risk medical devices. By the time FDA clearance arrived, the company reported more than 130,000 users across Europe. This real world experience provides valuable data on how the device performs outside of clinical studies.
One Sensor, One Waveform
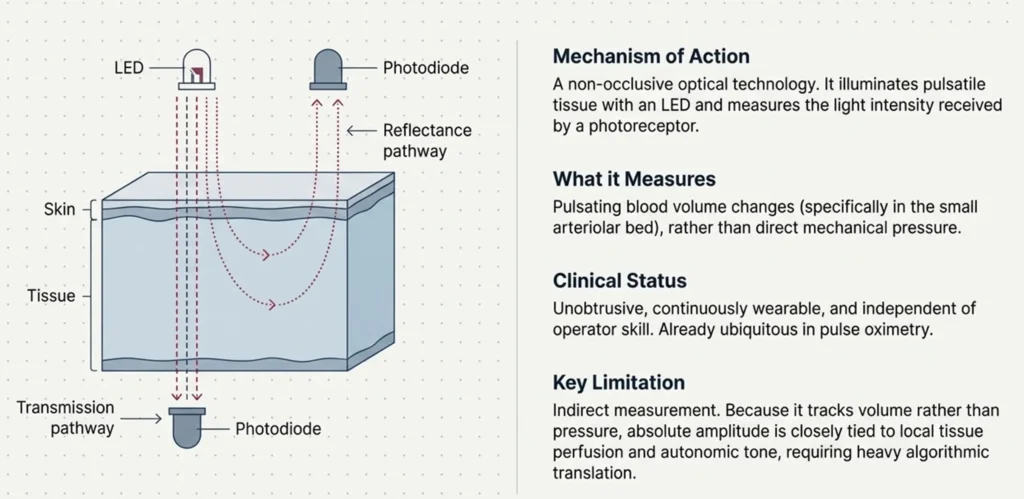
The Aktiia Hilo band works with a green LED. Light from the LED travels through the tissue, and the returning light is detected by a photodetector. This is the same technology used in pulse oximeters or smartwatches with PPG sensors. It is non-invasive and comfortable for continuous wear.
Light enters the tissue and reflects off blood vessels. With each heartbeat, the blood volume in the vessels changes. This change causes the amount of reflected light to vary. How blood moves through the vessels and the pressure the vessels are under creates a waveform that can differ from person to person. Arterial stiffness, age, disease, and anatomical differences between individuals all affect this waveform.
The band takes 30 second measurements. It collects 100 PPG samples per second and uses this data to estimate blood pressure. The device only takes measurements when the wearer is still, which ensures better signal quality. This automated approach means users do not need to remember to take measurements. The device builds a continuous record throughout the day and night.
The general characteristics of PPG are well understood. Blood flow varies between individuals and is affected by room temperature, the contact pressure on the skin, and arm position. As the arm’s position relative to the heart changes, venous pressure and arterial signal strength also change. Aktiia’s algorithms are designed to account for these factors.
Using a single signal avoids the design complexity of synchronizing multiple signals. This makes the device simpler, more reliable, and easier to wear.
The real challenge is this: It is difficult to prove a direct causal relationship between a change in the waveform and blood pressure. When the waveform changes, it is hard to separate whether this is caused by blood pressure or by other factors like vascular tone, temperature, stress, or something else. There is correlation, but establishing causation is more complex. Differences that develop with age and disease make this relationship even more complicated.
What the Algorithm Actually Reads
With each heartbeat initiated by the sinoatrial node, blood is pumped into the vessels. This causes an increase in the PPG signal. Between heartbeats, the heart muscle relaxes and the pressure in the vessels changes. This change appears as a decrease in the PPG signal. This cycle creates an oscillation that repeats with every heartbeat.
When blood is first pumped, the pressure in the vessels reaches its highest point. This maximum point is called the systolic peak. Algorithms detect this peak and use it as a reference point in their analysis.
When the heart finishes pumping, the ventricle relaxes. Pressure in the vessels begins to fall. When the pressure in the ventricle drops below the pressure in the aorta, the aortic valve closes. This closure prevents blood from flowing back into the heart.
The closing of the valve creates a brief pressure fluctuation in the column of blood in the aorta. The elastic structure of the aorta dampens this fluctuation and helps move blood forward. In the PPG signal, this event appears as a brief increase called the dicrotic notch. After this momentary fluctuation, blood continues to move through the vessels and the signal continues to decrease until the next heartbeat.
The pressure wave does not just move forward. Part of it reflects back. Where the arteries branch or narrow, some of the wave energy returns toward the heart. This is called the reflected wave.
What we measure with the PPG sensor is actually the sum of two things: the forward wave traveling from the heart and the reflected wave coming back.
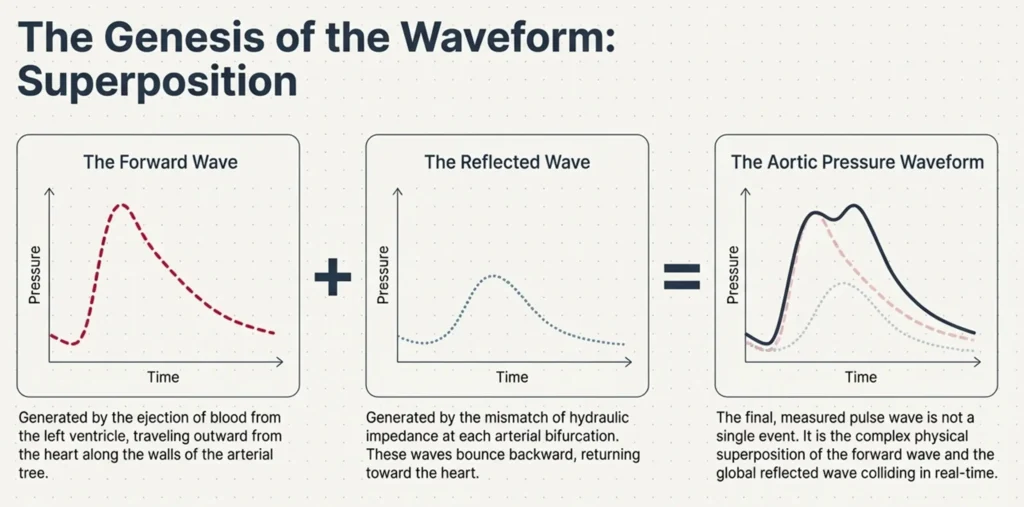
The timing of the reflected wave provides useful information. In young and healthy individuals, the wave travels slowly. The reflected wave arrives late, during diastole. It adds to the signal when the heart is relaxing. In older individuals or those with stiffer arteries, the wave travels faster. The reflected wave arrives early, during systole. It adds to the signal while the heart is still pumping.
This has physiological effects. If the reflected wave arrives early, it adds to the systolic peak. If it arrives late, it adds to diastole and helps blood flow into the coronary arteries that supply the heart muscle itself.
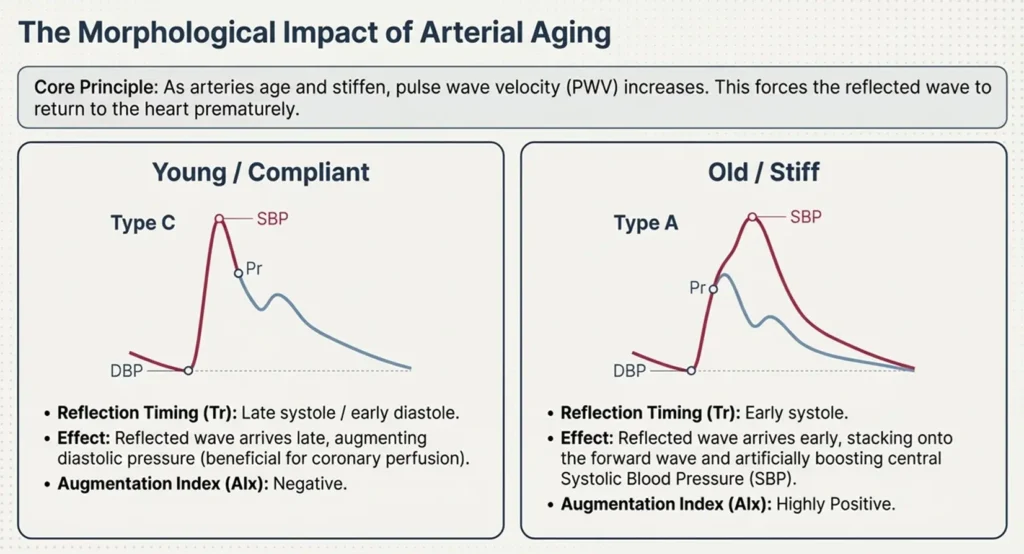
Pulse wave analysis examines this structure. By detecting when the reflected wave arrives, algorithms can estimate arterial stiffness. Arterial stiffness is related to blood pressure and cardiovascular health. For a more in-depth look at the history, physiology, and clinical applications of this technique, see the chapter Pulse Wave Analysis Techniques by Proença and colleagues.
Some technical terms are used to describe these concepts:
- Forward wave — The wave traveling from the heart to the periphery.
- Reflected wave — The wave returning from branch points or resistance sites.
- Tr (timing of reflection) — When the reflected wave arrives.
- Augmentation Index (AIx) — How much the reflected wave adds to the systolic peak.
- Pulse Wave Velocity (PWV) — How fast the wave travels. It is faster in stiffer arteries.
Why 100 Hz Is Enough
The Aktiia band collects 100 samples every second. That means one data point every 10 milliseconds. A 30 second measurement collects 3000 data points for analysis. This provides sufficient resolution to capture the important features of the pulse waveform.
At rest, the heart beats 60 times per minute, which is one beat per second. This gives 100 data points per heartbeat. But heart rate can vary between 40 and 240 beats per minute. At 240 BPM, there are 4 beats per second, which means 25 data points per heartbeat. For a 4 Hz signal, a 100 Hz sampling rate is well above the Nyquist requirement of 8 Hz. This means the sampling rate is theoretically sufficient to capture all the frequency information in the signal.
If we consider a more realistic high value of 120 BPM, that is 2 beats per second. In a 30 second recording, this gives 60 heartbeats to analyze. After removing edge effects, approximately 56 beats remain for averaging. This provides a robust basis for pulse wave analysis.
Higher sampling rates would allow even more precise detection of fast events like the systolic peak and the dicrotic notch. But the 100 Hz rate represents a practical balance between accuracy and battery life. Users get continuous monitoring throughout the day without needing to charge the device constantly.
The Calibration Problem
The PPG signal does not measure blood pressure directly. It measures light absorption. The signal amplitude can vary from person to person due to skin color, blood flow, contact pressure, room temperature, and anatomical differences. This is why calibration is needed.
The algorithm can detect changes in blood pressure from the waveform shape, but it cannot measure absolute values without a reference. This is where the calibration process comes in.
The user takes a measurement with a standard cuff. The device matches this value with the PPG signal at that moment. In subsequent measurements, it calculates blood pressure changes relative to this baseline. This approach is standard for cuffless blood pressure devices.
Stress, temperature, medications, and circadian rhythms can change vascular tone. Arteries constrict and relax throughout the day. These changes can affect the relationship between PPG and blood pressure. Aktiia addresses this by recommending monthly recalibration, which resets the baseline and maintains accuracy over time.
As Stergiou and colleagues emphasized in their 2026 paper, The quest for accurate wearable blood pressure monitors, cuffless devices require specific testing that goes beyond standard protocols:
- Calibration stability should be tested over time.
- Position effects such as lying and standing need evaluation.
- Drift over weeks and months should be measured.
Aktiia has conducted studies to address these questions. A 2019 study by Proença and colleagues, PPG-Based Blood Pressure Monitoring by Pulse Wave Analysis: Calibration Parameters are Stable for Three Months, followed 13 healthy individuals over three months and showed that calibration parameters remained stable. In a leg exercise protocol, the device accurately tracked blood pressure changes. This provides evidence that the technology can maintain accuracy over reasonable time periods.
Questions remain for specific populations. How does the device perform in patients with hypertension? What about after medication changes or weight loss? These are areas for future research as more users adopt the technology.
Conflict of Interest
The author of this article has no direct financial or professional relationship with Aktiia SA or any of its competitors. This article was written independently and reflects the author’s own research and analysis based on publicly available scientific literature and regulatory documents.
No compensation was received for the writing or publication of this article. The author’s goal is to provide readers with accurate, balanced information about cuffless blood pressure monitoring technology to support informed decision-making.
You Might Also Like
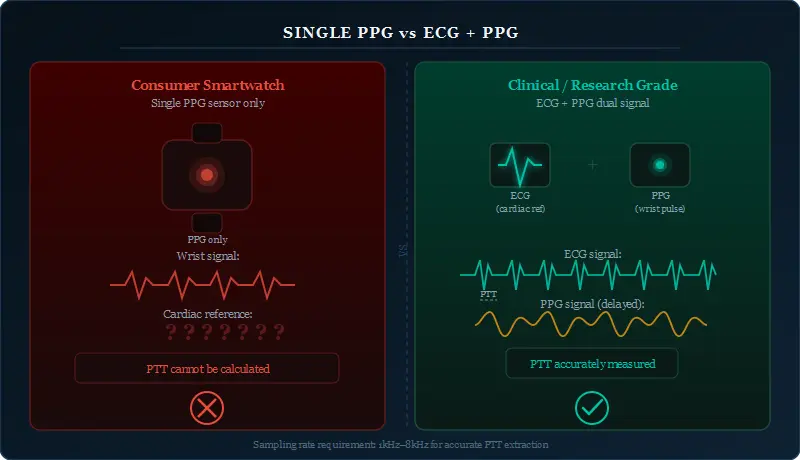
This article explored the technology behind Aktiia Hilo in detail. But how accurate are smartwatches in general when it comes to blood pressure measurement? Why is a single PPG sensor insufficient? How should Pulse Transit Time (PTT) technically work?
Can Your Smartwatch Really Measure Blood Pressure? examines these questions in depth.
This article covers: technical requirements of PTT, limitations of single-sensor devices, the problem with population models, and realistic use cases.
References
- Stergiou GS, Menti A, Mariglis D, Kollias A. The quest for accurate wearable blood pressure monitors. Hypertens Res. 2026;49:1025-1029. Link
- Proença M, Bonnier G, Ferrario D, Verjus C, Lemay M. PPG-based blood pressure monitoring by pulse wave analysis: calibration parameters are stable for three months. Annu Int Conf IEEE Eng Med Biol Soc. 2019;2019:2960-2963. Link
- Proença M, Renevey P, Braun F, et al. Pulse Wave Analysis Techniques. In: Solà J, Delgado-Gonzalo R, eds. The Handbook of Cuffless Blood Pressure Monitoring. Springer, Cham; 2019. Link
- FDA 510(k) Premarket Notification database. K250415. Link