Introducing the Resting Heart Rate Calculator
BioSenseReview
I built a resting heart rate calculator (try it here). It uses CDC NHANES data from ten years of population surveys, about thirty thousand people, measured after five minutes of quiet sitting, and breaks the results down by age and biological sex.
Why it exists
The standard advice is “60 to 100 beats per minute is normal.” That statement is technically correct. It is also nearly useless. Sixty two and seventy eight are both in that range. They are not the same thing. One reflects good cardiovascular efficiency. The other sits at the higher end of normal and, in longitudinal studies, correlates with different outcomes. Collapsing them into the same category hides what matters.
Age changes things. Sex changes things. Female resting heart rates run three to seven beats higher than male across every age group. A calculator that ignores this will call women elevated when they are simply normal for being women.
This one accounts for all of it.
How it works
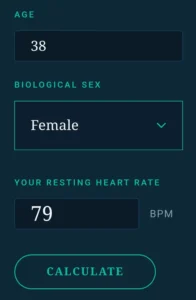
You enter three things:
- Your age
- Your biological sex
- Your resting heart rate (the number your smartwatch gives you in the morning)
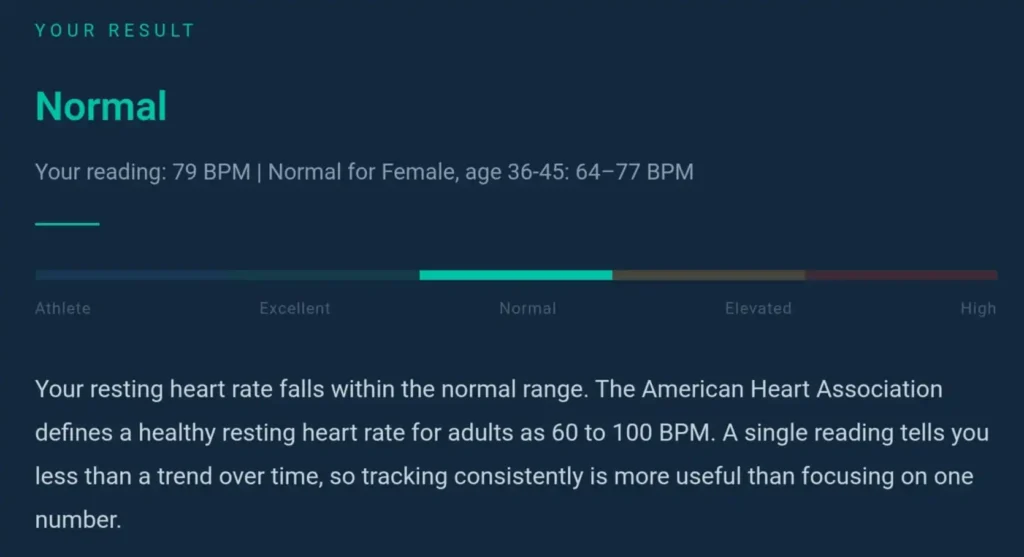
The calculator tells you where you sit relative to the population distribution, not just “normal” or “abnormal,” but one of five categories:
Athlete – 40 to 59 BPM
The bottom of the curve. In endurance athletes, this is a physiological adaptation. If you are not an athlete and this is consistent, it is worth mentioning to a physician.
Excellent – 60 to 65 BPM
Good cardiovascular efficiency. Common in people who exercise regularly. Not elite, just solid.
Normal – 66 to 79 BPM
The middle of the distribution. Most adults sit here. Watch the trend over time, not the single number.
Elevated – 80 to 99 BPM
Still within the AHA’s normal range but in the upper percentiles. Short term factors can raise heart rate, poor sleep, dehydration, stress. If it stays here consistently, pay attention.
High – 100+ BPM
Meets the clinical definition of resting tachycardia. Multiple causes. If persistent, a physician should evaluate it.
The reference table
Below the calculator there is a table showing normal ranges by age group and sex. Same data the calculator uses, laid out so you can see the stratification yourself.
| Age | Male (BPM) | Female (BPM) |
|---|---|---|
| 18–25 | 62–73 | 63–76 |
| 26–35 | 62–74 | 63–76 |
| 36–45 | 63–75 | 64–77 |
| 46–55 | 64–76 | 65–78 |
| 56–65 | 64–77 | 65–79 |
| 65+ | 65–78 | 66–80 |
Women run higher across the board. That is physiology, not pathology.
What this is not
It is not a diagnostic instrument. The ranges are population distributions, not individual clinical targets. Your normal might sit outside them based on fitness, medications, or things the data cannot capture. If something feels wrong, see a physician.
It runs entirely in your browser. Nothing gets sent anywhere.
If you track your resting heart rate, this gives you context (use it here). If you do not, ignore it.